Hypothesis Testing and Correlation Analysis Using R
Welcome!
Today we will be Hypothesis Testing and Correlation Analysis using R programming
1.
A.
State the null and alternative hypothesis:
B.
Given Data:
- Population mean
- Sample mean
- Standard deviation
- Sample size
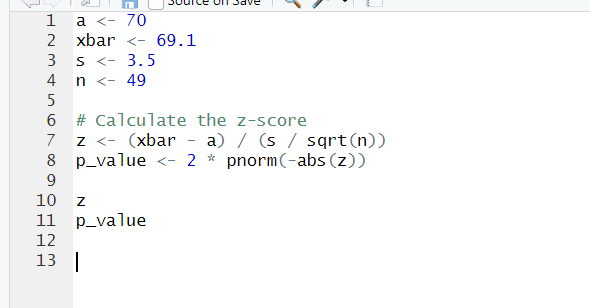
R Code to Calculate the Test Statistic and p-value:
INPUT:
OUTPUT:
- Calculated z-score:
- From running the above R code, you'll find that the Z-score is -1.8
- Calculated p-value:
- From running the above R code, you'll find that the p-value is approximately 0.07
C.
Explanation:
The p-value of approximately 0.0718 indicates that there is a 7.18% probability of observing a sample mean as extreme as 69.1 pounds (or more extreme) if the null hypothesis is true. Since this is greater than the significance level (0.05), we do not have enough evidence to reject the null hypothesis.
D.
What if the standard deviation were specified as 1.75 pounds?
Update the standard deviation in R code:
s <- 1.75
INPUT:
OUTPUT:
- Calculated z-score:−3.6
- p-value: The p-value will be much lower than 0.05.
Since , we reject the null hypothesis. There is evidence that the machine is not meeting specifications.
E.
What if the sample mean were 69 pounds and the standard deviation is 3.5 pounds?
Update the sample mean in R code:
xbar <- 69
INPUT:
Since , we reject the null hypothesis. There is evidence that the machine is not meeting the manufacturer's specifications.
2.
Set up a 95% confidence interval estimate of the population mean
Given Data:
- Sample mean x̅ = 85
- Standard deviation
- Sample size
R Code to Calculate the Confidence Interval:
INPUT:
OUTPUT:
3.
Our Data Set:
Let's perform a Correlation Analysis on this data set:
Correlation Coefficient (Pearson's r):
- Girls: 0.982
- Boys: 0.989


Comments
Post a Comment